前言
在以前的文章 中,我介绍了两种分析Django视图函数性能的工具:Django Debug Toolbar和cProfile中间件。在实际开发过程中,前者的SQL执行分析是相当实用的功能。
但美中不足的是,Django Debug Toolbar只能在浏览器里分析响应类型为HTML的视图函数,这就导致响应类型为JSON的视图函数必须要借助Django Rest Framework框架中的HTMLRenderer等手段修改自身的响应类型,否则无法使用该工具。
那有没有更直接的手段,来为JSON视图函数分析SQL执行情况呢?这就是文本要探究的问题。
注:本文所使用的运行环境为Python 3.6+Django 2.2
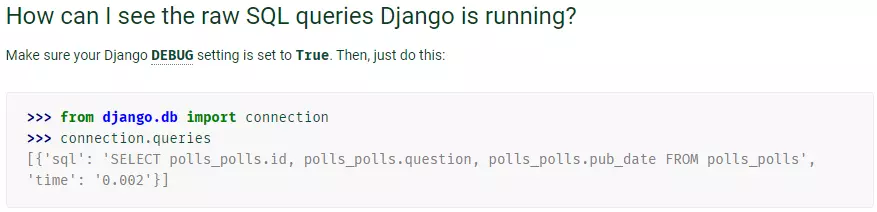
Django中的SQL执行 在查阅了相关文档后,我发现事情比我想象中的简单。在Django官方文档中的FAQ: Databases and models 有这样的描述:
如此一来方法就很清晰了:写一个中间件,将connection.queries里的内容插入到JSON响应中。中间件代码如下:
1 2 3 4 5 6 7 8 9 10 11 12 13 14 15 16 17 18 19 20 21 22 23 24 25 26 27 28 29 30 31 32 33 34 35 36 37 38 39 40 import jsonfrom django.conf import settingsfrom django.core.exceptions import MiddlewareNotUsedfrom django.db import connectionsfrom django.http.response import HttpResponseclass ProfileMiddleware (object ):def __init__ (self, get_response ):if not settings.DEBUG:raise MiddlewareNotUsed def __call__ (self, request ):if request.GET.get("profile" ) == "db" and "application/json" in repr (response):try :except (TypeError, ValueError):return response for alias in connections:for query in connections[alias].queries:if query["sql" ] not in self.ignore_sql:"using" ] = aliasif isinstance (data, dict ):"_debug_sql" ] = sql_querieselif isinstance (data, list ):"_debug_sql" : sql_queries})return response
写个简单视图函数来验证一下:
1 2 3 4 5 6 7 8 from django.contrib.auth.models import Userfrom django.http import JsonResponsedef user_count (request ):"count" : User.objects.count()}return JsonResponse(data)
1
2
3
4
5
6
7
8
9
10
11
$ curl -s localhost:8000/user_count/\?profile=db | python3 -m json.tool
和cProfile中间件组合 在以前的文章 中我也介绍了使用cProfile中间件来分析Django视图函数的Python代码执行情况,这里就顺便组合起来。
1 2 3 4 5 6 7 8 9 10 11 12 13 14 15 16 17 18 19 20 21 22 23 24 25 26 27 28 29 30 31 32 33 34 35 36 37 38 39 40 41 42 43 44 45 46 47 48 49 50 51 52 import cProfileimport jsonimport pstatsfrom io import StringIOfrom django.conf import settingsfrom django.core.exceptions import MiddlewareNotUsedfrom django.db import connectionsfrom django.http.response import HttpResponseclass ProfileMiddleware (object ):def __init__ (self, get_response ):if not settings.DEBUG:raise MiddlewareNotUsed def __call__ (self, request ):if request.GET.get("profile" ) == "cprofile" :'tottime' return HttpResponse(ram_file.getvalue().encode('utf-8' ), 'text/plain' )if request.GET.get("profile" ) == "db" and "application/json" in repr (response):try :except (TypeError, ValueError):return response for alias in connections:for query in connections[alias].queries:if query["sql" ] not in self.ignore_sql:"using" ] = alias"_debug_sql" ] = sql_queriesreturn response
同样验证一下:
1
2
3
4
5
6
7
8
9
10
11
12
$ curl -s localhost:8000/user_count/\?profile=cprofile # 省略
总结 不得不感叹Django真是一个功能完善、生态丰富的Web框架,这篇文章只是站在巨人的肩膀上取得了一些微不足道的成就。Django Debug Toolbar虽然也是通过connection.queries的方式获取了SQL执行情况(panel.py#L58 ),但其所做的工作远不止如此,值得细看。