用Prometheus监控硬盘SMART信息
1. 背景
笔者的NAS(或者说ALL IN ONE主机)内有两块3.5寸的机械硬盘。群晖、TrueNAS等系统内置了比较完善的监控,可通过SMART信息(参数、温度、通电时长等)观察硬盘健康状况。可惜笔者使用的是Ubuntu系统,只能定期通过命令行进行检查。为了更方便地掌握硬盘的健康状况,笔者决定搭建一套关于硬盘的监控解决方案。
2. 思路
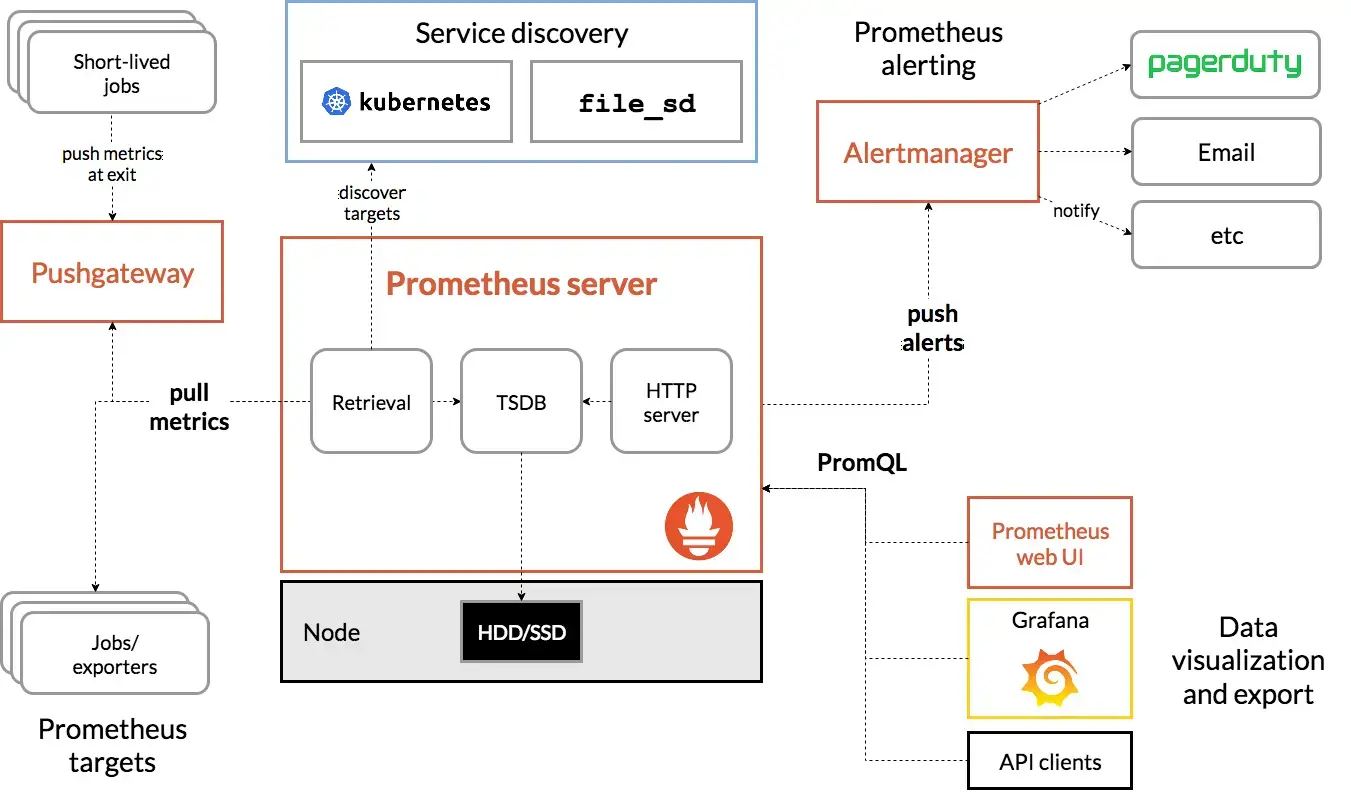
由于笔者已经搭建了一套Prometheus监控套件,所以该解决方案也会基于Prometheus搭建。我们可以像之前的文章[1]一样通过代码上报SMART信息,但监控硬盘作为比较通用的需求,应该已经有成熟方案了。果不其然,node-exporter-textfile-collector-scripts仓库提供了SMART信息抓取脚本,可通过node_exporter的textfile-collector提供给Promethues。整体的流程如下所示:
flowchart LR
    A[数据抓取脚本]--sponge-->B[.prom文件]
    C[node_exporter]--读取-->B

    D[Promethues]--pull-->C
    D-->E[Alertmanager]
    E-->G[Telegram告警]
    F[Grafana监控]-->D
    style A stroke-dasharray:5
    style B stroke-dasharray:5
3. 施工
下载抓取脚本。克隆仓库后,使用root权限命令执行
smartmon.sh即可看到SMART输出:1
2
3git clone git@github.com:prometheus-community/node-exporter-textfile-collector-scripts.git
cd node-exporter-textfile-collector-scripts
sudo ./smartmon.sh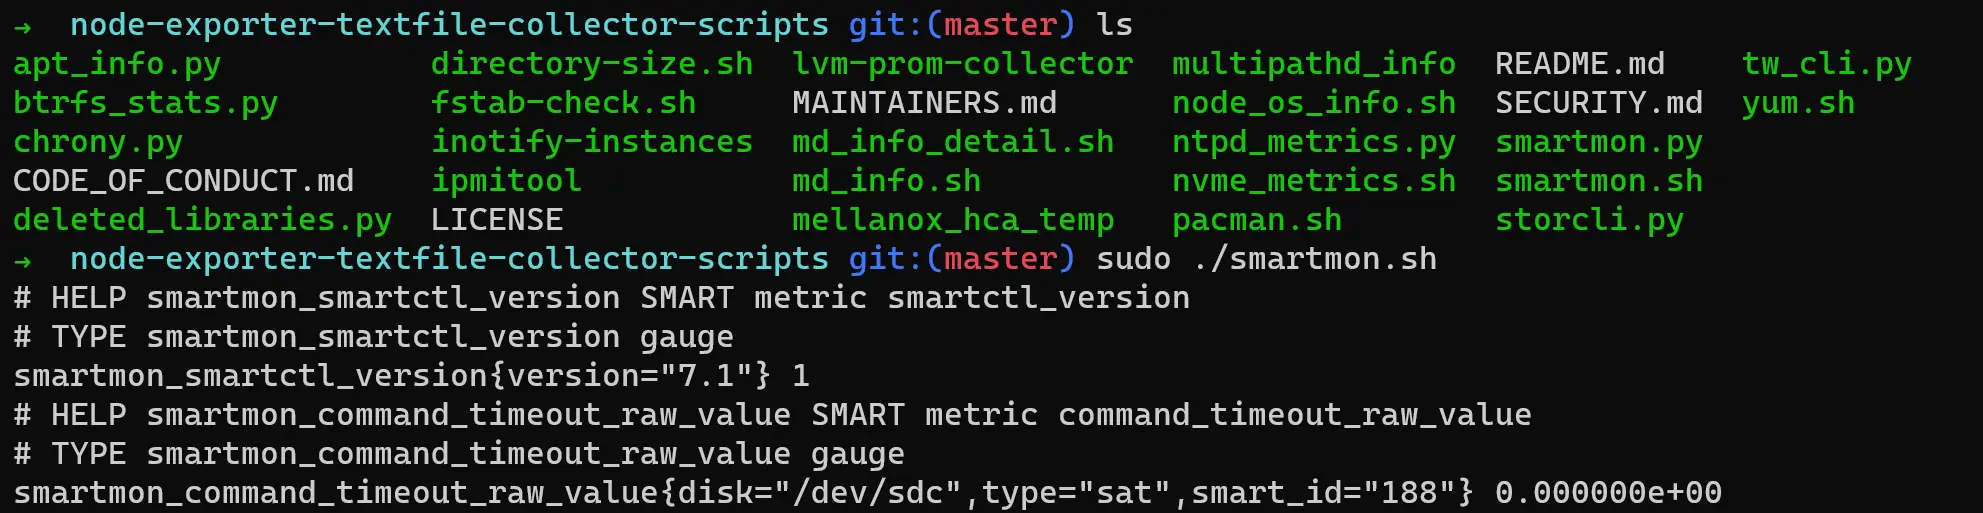
同时按照仓库的推荐,安装sponge用于输出重定向:
1
sudo apt install moreutils定时运行脚本并保存结果。由于获取SMART信息需要root权限,所以笔者使用root用户的crontab,每分钟运行一次抓取脚本:
1
sudo crontab -e1
* * * * * /home/worker/git/prometheus-community/node-exporter-textfile-collector-scripts/smartmon.sh | sponge /home/worker/log/smartmon.prom 2>/home/worker/log/smartmon.stderr之所以使用sponge而不是管道进行输出重定向,是因为shell在进行输出重定向时会先清空原文件,导致node_exporter在读取时有机率读取到空数据。验证一下:
1
2
3
4
5$ head ~/log/smartmon.prom
# HELP smartmon_smartctl_version SMART metric smartctl_version
# TYPE smartmon_smartctl_version gauge
smartmon_smartctl_version{version="7.1"} 1
# ...配置node_exporter。在运行node_exporter时指定
textfile-collector目录,然后可通过curl验证:1
node_exporter --collector.textfile.directory='/home/worker/log/'1
2
3
4
5
6$ curl 127.0.0.1:9100/metrics
# ...
# HELP smartmon_smartctl_version SMART metric smartctl_version
# TYPE smartmon_smartctl_version gauge
smartmon_smartctl_version{version="7.1"} 1
# ...配置监控。有国外网友针对上述脚本配置了精美的Grafana面板并分享在了GrafanaLabs上[2],在Grafana上输入其ID
13654即可导入: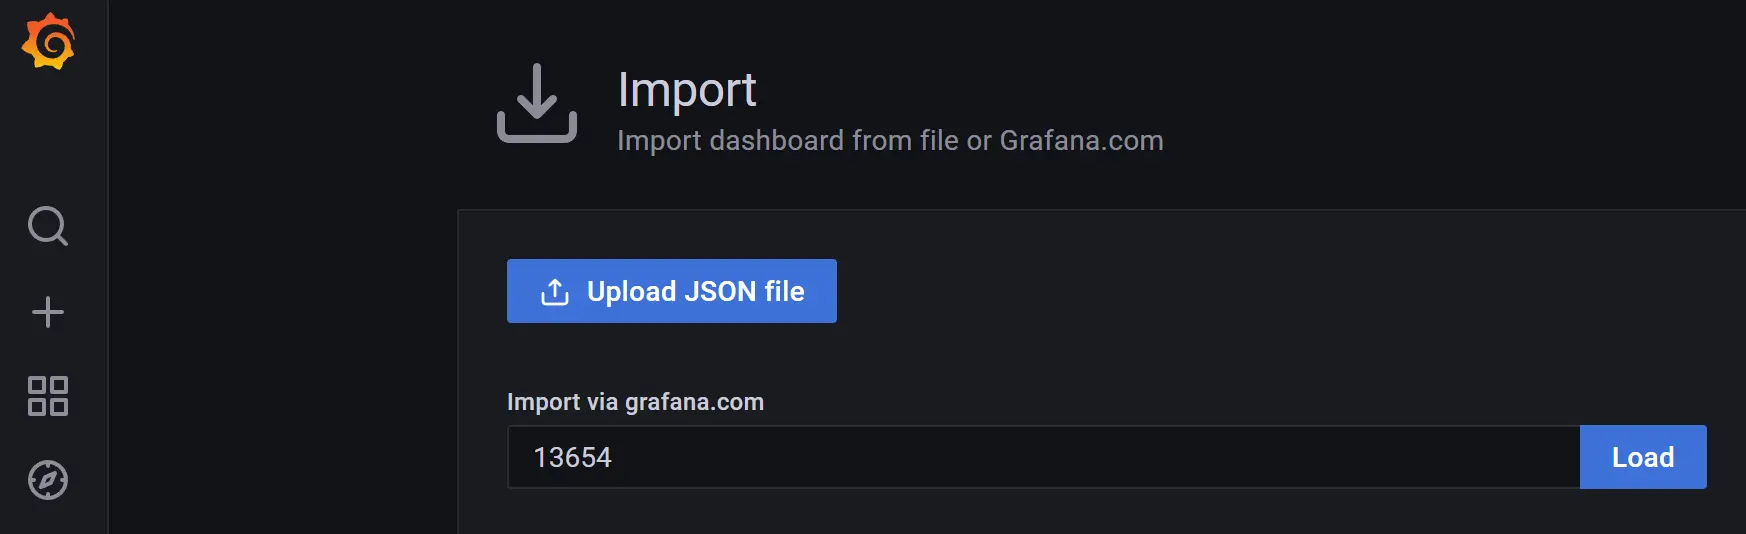
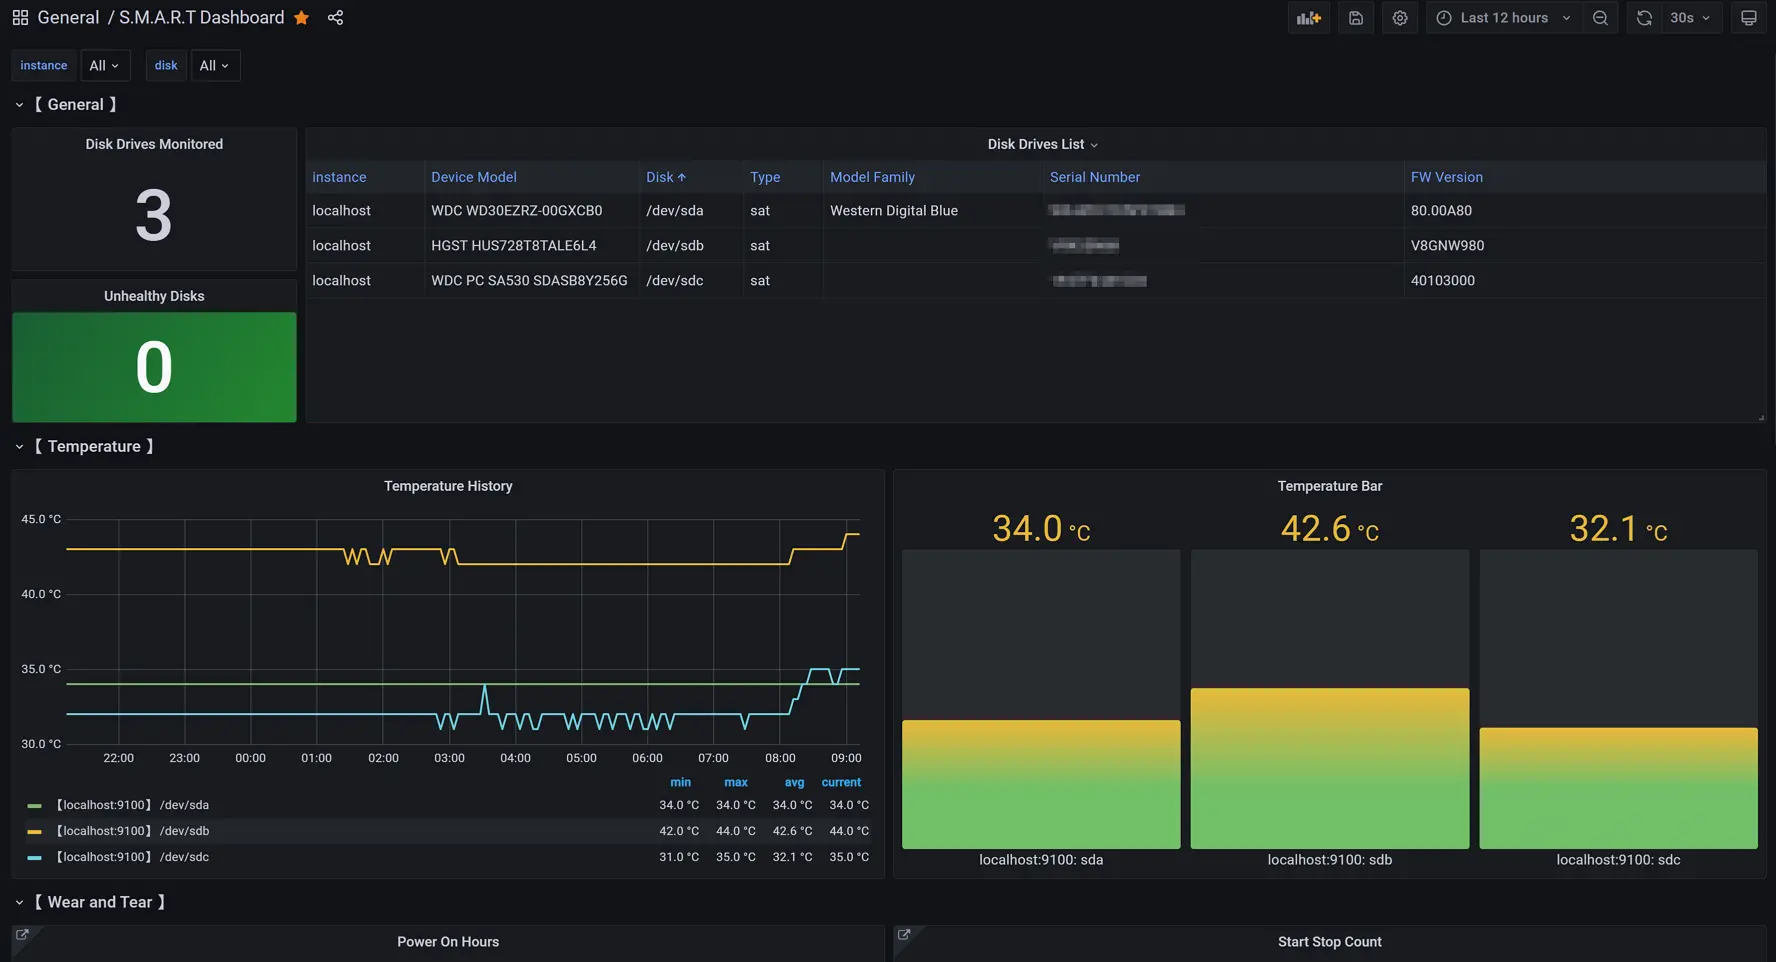
修复面板。左上角
Unhealthy Disks的原查询语句为:1
sum(smartmon_device_smart_healthy{instance=~"$instance"})-sum(smartmon_device_smart_healthy{instance=~"$instance"})由于减号两边相等,所以看起来这个查询结果永远为0。笔者发邮件询问了原作者,不过还没有得到回复。改动为如下查询语句应该应该能修复这个问题:
1
count(smartmon_device_smart_healthy{instance=~"$instance"})-sum(smartmon_device_smart_healthy{instance=~"$instance"})设置告警。在alert配置文件(细节见之前的文章[1])中增加如下内容,promethues会在出现硬盘smart异常后对笔者进行告警:
1
2
3
4
5
6
7- name: smart
rules:
- alert: unhealthy_disks
expr: count(smartmon_device_smart_healthy)-sum(smartmon_device_smart_healthy) > 0
for: 10m
annotations:
summary: "有不健康的硬盘"
4. 效果
最终效果如下:
|
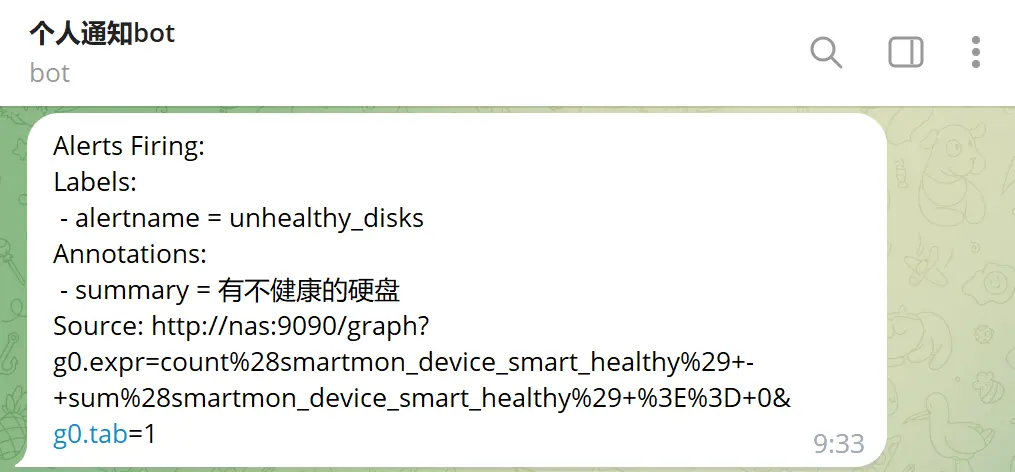 |
|---|---|
| Grafana看板 | Telegram通知 |